
Measuring App Performance
Google Lighthouse
As web development continues to evolve, the importance of performance, accessibility, and best practices cannot be overstated. Google Lighthouse helps developers by:
- Evaluating Performance: Measures load times and provides metrics like First Contentful Paint and Time to Interactive.
- Ensuring Accessibility: Checks for accessibility features, such as image alt attributes and semantic HTML tags.
- Identifying Best Practices: Warns you about the use of outdated libraries, missing
rel="noopener", etc. - Checking for SEO Issues: Looks for elements that could impact search engine rankings, such as meta descriptions and proper header tags.
By automating these checks, Google Lighthouse offers a structured way of ensuring that your web application meets modern web development standards.
How Lighthouse Works
Lighthouse simulates a mobile or desktop device and runs a series of audits against a web page. It then generates a report that provides an overview of the site’s performance and suggestions for improvement.

How to Use Lighthouse
Browser Version
Lighthouse comes integrated with Google Chrome’s Developer Tools. Here’s how to run a Lighthouse audit via Chrome:
- Make sure to open a guest or incognito window to avoid any interference from browser extensions.
- Right-click on a page element and select “Inspect” or use
Ctrl+Shift+I(Cmd+Option+Ion Mac) to open Developer Tools. - Go to the “Lighthouse” tab.
- Choose the types of audits you wish to run (Performance, Accessibility, etc.)
- Click on the “Generate report” button.

Command-Line Interface
You can also use Lighthouse from the command-line, which is useful for automated tests.
First, you’ll need to install Lighthouse using npm:
npm install -g lighthouseTo run an audit:
lighthouse https://example.comThis will produce a report in HTML format that you can view in your web browser.
As a Node Module
For more programmatic usage, you can incorporate Lighthouse as a Node.js module in your development workflow:
First, install it as a development dependency:
npm install --save-dev lighthouseThen, you can use it in your Node scripts:
const lighthouse = require("lighthouse");const chromeLauncher = require("chrome-launcher");
async function run() {  const chrome = await chromeLauncher.launch({ chromeFlags: ["--headless"] });  const options = {    logLevel: "info",    output: "html",    onlyCategories: ["performance"],    port: chrome.port,  };  const runnerResult = await lighthouse("https://example.com", options);
  // `.report` is the HTML report as a string  const reportHtml = runnerResult.report;  console.log(reportHtml);}
run().catch(console.error);
Understanding the Lighthouse Report
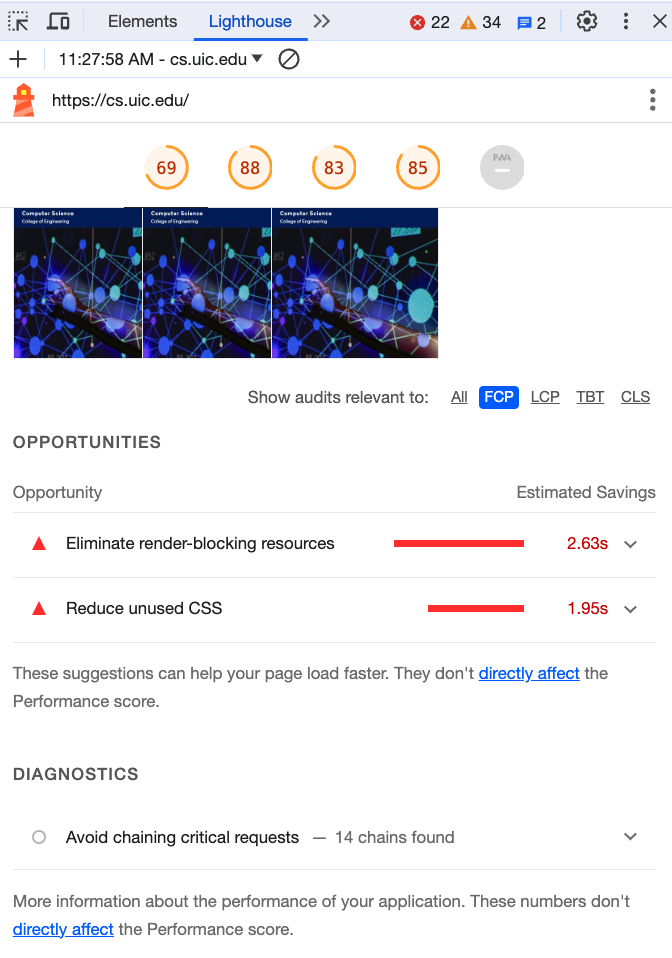
The Lighthouse report is divided into different sections for each category of audit, such as Performance, Accessibility, and so on. Each section will provide a score out of 100 and list individual audits that were conducted, along with recommendations for improvements.
Integrating Lighthouse into Development Workflow
The true power of Lighthouse comes when you integrate it into your regular development and testing workflows. You can do this in various ways:
- Continuous Integration: Run Lighthouse audits as part of your CI/CD pipeline to catch issues early.
- Pre-commit or Pre-push Hooks: Use git hooks to run Lighthouse audits before code gets committed or pushed.
- Regular Auditing: Make it a routine to run Lighthouse checks during development sprints.
By integrating Lighthouse, you can ensure that your web application not only performs well but also adheres to modern best practices, making it more robust, accessible, and user-friendly.
Below is an example GitHub Action that can integrate Lighthouse into your CI/CD pipeline (more info):
name: Lighthouse CIon: pushjobs: lighthouse: runs-on: ubuntu-latest steps: - uses: actions/checkout@v3 - name: Audit URLs using Lighthouse uses: treosh/lighthouse-ci-action@v10 with: urls: | https://cs.uic.edu/ https://www.cs.uic.edu/~ckanich/ budgetPath: ./budget.json # test performance budgets uploadArtifacts: true # save results as an action artifacts temporaryPublicStorage: true # upload lighthouse report to the temporary storageGoogle Lighthouse is an invaluable tool for modern web development. By understanding how to use it effectively, you can significantly improve the quality of your web applications.